


Infrastructure
-
Save to favoritesShare with your friends
-
Learn more about the report
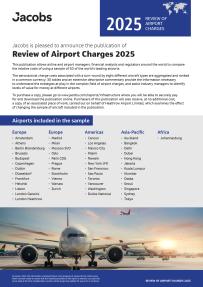
This publication allows airline and airport managers, financial analysts and regulators around the world to compare the relative costs of using a sample of 50 of the world’s leading airports.
The aeronautical charge costs associated with a turn-round by eight different aircraft types are aggregated and ranked in a common currency. 30 tables and an extensive descriptive commentary provide the information necessary to understand the strategies at play in the complex field of airport charges, and assist industry managers to identify levels of value for money at different airports.
Newer Aircraft, Lower Charges: Heathrow’s Recalculated Charges

We have been commissioned by Heathrow Airport Limited (HAL) to carry out a sensitivity test to understand the impact of adopting an alternative aircraft sample to that used in the Review of Airport Charges 2025. HAL proposed substituting three of the eight aircraft in the published sample with types that more closely reflect Heathrow’s operational fleet profile and its charging structure, which incentivises newer generation and quieter aircraft. Through this incentivisation, the airport has successfully increased the proportion of Chapter 14 aircraft using the Airport when compared to global benchmarks and the global fleet mix. The substituted aircraft generally fall within lower (quieter) noise charge categories than the aircraft they replace.
This report is provided alongside the Review of Airport Charges 2025 for purchasers at no additional cost.
Our approach to the selected fleet mix in Review of Airport Charges
In line with our long-term approach in Review of Airport Charges, the fleet mix is selected to be globally representative and cover a range of types (manufacturers, seating capacities, Maximum Take-Off Weights etc.) commonly used on international services worldwide.
The fleet mix is updated periodically as older types become less common and new aircraft enter service, with the most recent update undertaken in 2020. Since then, new aircraft types have been delivered, although the rate of delivery and level of deployment has been impacted by supply-chain and reliability issues. Following a review of the global seats and frequencies by common aircraft types, some changes have been made to the fleet sample for the 2025 Review, however, some key newer types remain excluded, despite entering service at an increasing pace.
Newer generation aircraft being delivered are often concentrated at key global hubs, many of which are featured within our current sample of 50 airports. However, the Review is intended to provide a benchmark applicable to all major airports, not just those included within our sample. For airports not included in the sample, the broader global fleet may be more representative and so this allows better comparability. This approach also allows us to adjust the 50 airports which are included within the report as needed without distorting the assessment from year to year.
We recognise that the global fleet mix is evolving quickly and that a number of aircraft types are at a tipping point of becoming more dominant in the global fleet. We therefore expect to review and update the sampled fleet mix again in the near term. Nevertheless, when examining a single airport in detail, differences between its actual fleet and the globally representative sample mean that charges calculated for benchmarking do not align perfectly with the real income for those airports.
