Flying High: 36 Key Indicators to Optimize Airport Performance
The question is: how do airports globally ensure they grow at a sustainable rate and generate more commercial value than industry peers? By measuring and optimizing the right metrics.
We've done the hard work for you: our report takes readily available but complex industry information, applies our expert analysis using a best-in-class approach and pulls out key insights based on 36 key financial and operational performance metrics. Our report dives deep into the performance of 48 major airports from across the world to elevate your strategic planning with real industry insights. Airports featured include Heathrow, Brisbane, Hong Kong, New York (JFK), San Francisco and Vienna.
Whether you’re an airport interested in how your revenue performance per passenger compares to your peers, an airline seeking powerful insights to inform discussions with the airports you use, or a regulator wanting to understand an airport’s operating cost efficiency, this report is designed to provide you with insights to unlock better decision-making with normalized industry data.
-
5.2
billion passengers globally in 2025
-
36
key financial and operational metrics analyzed
-
48
major airports evaluated
5.2 billion passengers are expected to use airports globally in 2025 according to the International Air Transport Association (IATA), marking a 6.7% increase from 2024 and the first time surpassing the five billion mark. These numbers underscore aviation's pivotal role in the global economy and show how airports have rebounded from the pandemic slump. However, not all airports are growing or performing at the same level, with the gap between the top-performing airports and the rest growing since the pandemic in some cases.
Regions are experiencing varying levels of growth, and while there are many complex factors responsible for these variations, there is also the compounding challenge of industry decarbonization and achieving carbon neutrality by 2050. This requires the introduction of advanced fuel-efficient technologies and sustainable aviation fuels, and it all must be underpinned by significant technological innovations that enhance operational efficiency and improve the passenger experience. This report is designed to provide you with insights to unlock better decision-making with normalized industry data.
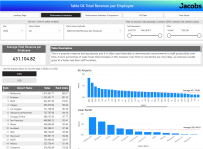
New: Interactive dashboard

This year, we are excited to launch an interactive dashboard for our annual Airport Performance Indicators publication. It is now available for purchase — either as an addition to the PDF or as a standalone product.
With the interactive dashboard, you can explore data more deeply, uncover trends, identify opportunities and make informed decisions with confidence. This powerful tool allows you to:
- Easily visualize data and interpret performance indicators with dynamic charts and graphs
- Tailor the dashboard to highlight metrics most relevant to your needs
- Compare performance metrics across airports and periods with ease
- Export dashboard data for further analysis


